
Tuesday, June 30, 2015
$SPY Trend and Momentum
There's a big gap just below current weekly support levels. The momentum indicator is already at exhaustion levels:

$SPY Bounce
The question now is whether those who panicked yesterday will be left out in the cold or will this correction run a tad longer:

Market breadth parameters indicate that the pendulum has swung back and the mo-mo crowd, after lingering at the top, is almost completely out:
And Greece is still broke.

Market breadth parameters indicate that the pendulum has swung back and the mo-mo crowd, after lingering at the top, is almost completely out:

And Greece is still broke.
Monday, June 29, 2015
$SPY Signs of Panic
Clear signs of panic in the air and three clear support levels for the SP-500:


and for the Qs:

The Panic meter, at the bottom of the charts, is coming back to life.
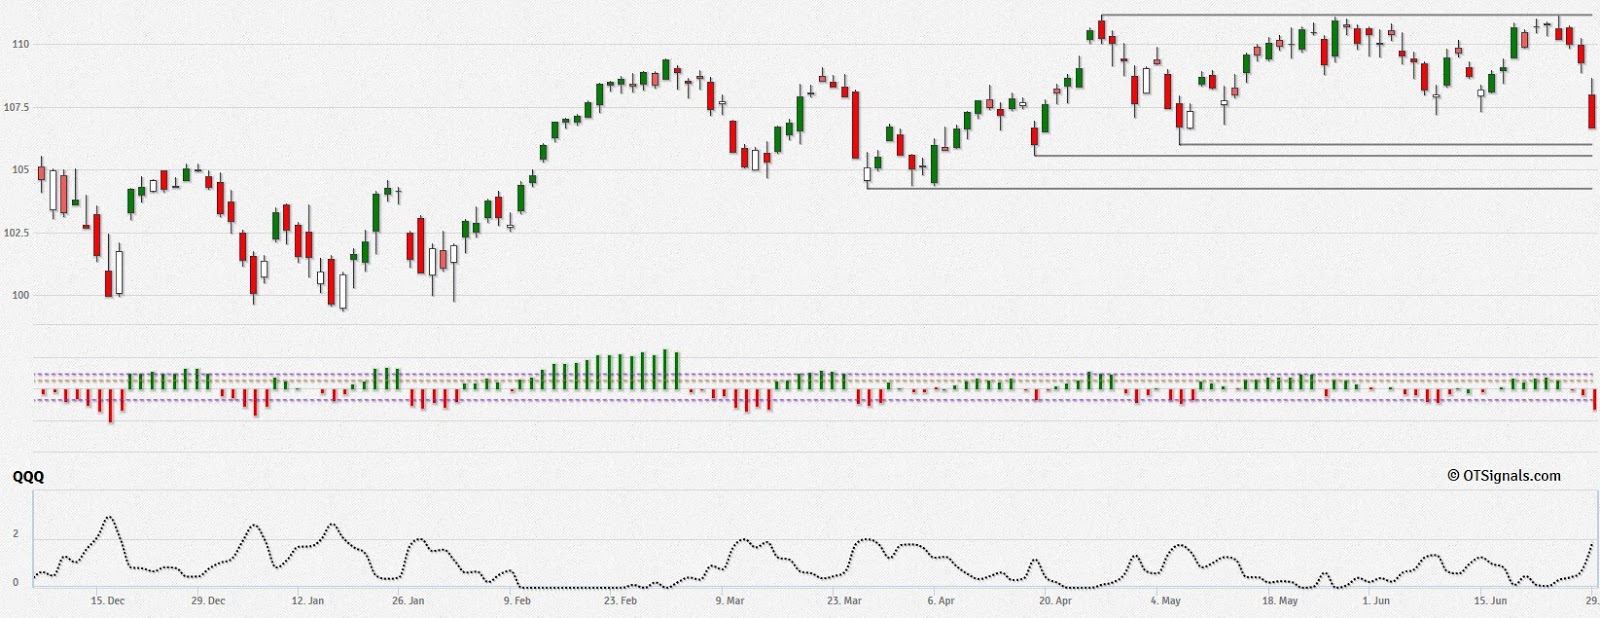
The Panic meter, at the bottom of the charts, is coming back to life.
Sunday, June 28, 2015
$SPY Marlet Update
As of June 24th, all major averages have slashed though their respective SAR Angles and are currently expected to start the week around the June lows:


Saturday, June 27, 2015
$IWM Trend and Greece
As of Friday, investors seemed to be favoring a positive resolution of the Greek crisis. The Russell 2000 bounced off the key 127 support level:

and the two Greek stocks, most closely associated with the outcome of the negotiations, finished the week inside a box:


The surprising call for a referendum in Greece is calling these assumptions into question. It also reinforces the notion that, given a chance to screw things up, politicians will never fail to do that.
Thursday, June 25, 2015
$IWM Trend and Greece
Decision time for the Russell 2000 which closed just above the key 127 breakout turned support level:

Meanwhile, the two symbols most closely associated with the Greek crisis are scrambling to remain in a short-term uptrend:


Meanwhile, the two symbols most closely associated with the Greek crisis are scrambling to remain in a short-term uptrend:


Wednesday, June 24, 2015
$IWM Pattern and Trend
The Russell 2000 slashed through the SAR Angle and 127 becomes key support:

while the narrower averages remain trapped in a tight range:


and market breadth retreats from overbought levels:

while momentum is fading:


while the narrower averages remain trapped in a tight range:


and market breadth retreats from overbought levels:
while momentum is fading:
Monday, June 22, 2015
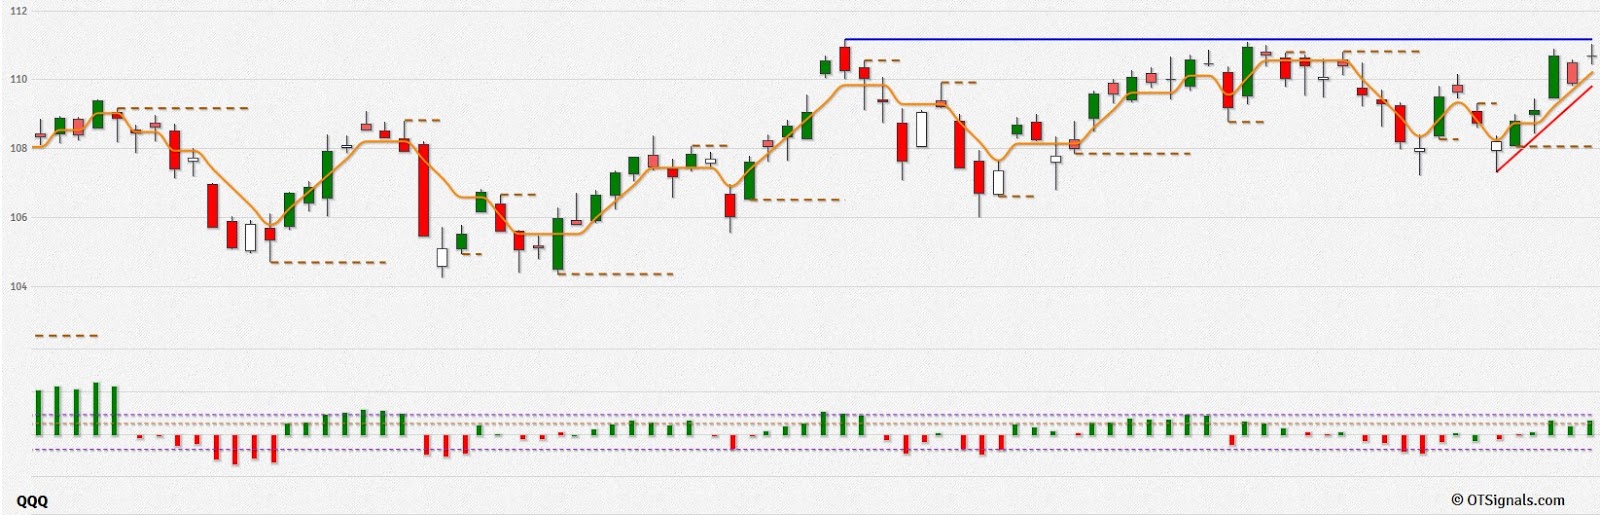
$QQQ Pattern and Trend
Qs testing tripple top; follow-through is of paramount importance at this juncture:

$IWM Pattern and Trend
Russell 2000 remains in a strong position as long as it trades above the SAR Angle which, currently, happens to coincide with the recent breakout level:


Friday, June 19, 2015
$SPY Bullish Sentiment
There's trouble brewing below the surface. Despite the fact that the SPX finished the week higher, bullish participation continued declining and dropped below 50%:


Thursday, June 18, 2015
$DIA Bullish Sentiment
Now that everybody is in once again:

the true resilience of this market will be tested in the next couple of days:


the true resilience of this market will be tested in the next couple of days:


Wednesday, June 17, 2015
$IWM Pattern and Trend
The broader market, as represented by the Russell 2000, is close to a breakout on investor friendly Fed news:


Monday, June 15, 2015

Saturday, June 13, 2015
$SPY Pattern and Trend
SPY stopped right on the SAR Angle:

Lower support comes in at 207.7.
The next FED meeting is on June 16 & 17.
Expecting a rebound going into the meeting.

Lower support comes in at 207.7.
The next FED meeting is on June 16 & 17.
Expecting a rebound going into the meeting.
Friday, June 12, 2015


Thursday, June 11, 2015
$SPY Pattern and Trend
The SPX broke decisively above the downsloping SAR Angle and triggered a new upswing and S/L level:


Wednesday, June 10, 2015
$IWM Pattern and Trend
The broader market, as represented by the Russell 2000, remained unfazed by weakness in the narrower indices (such as DJIA, NDX and SPX) and is challenging the '15 highs:


$SPY Pattern and Trend
Support channels drawn from Hashi (the chopstick indicator) point to a confluence of support levels between 2067 and 2072 for the SP500:

The Bottom finder indicator is nearing extreme levels.

The Bottom finder indicator is nearing extreme levels.
Monday, June 08, 2015
$IWM and $SPY Trend Update
Russell 2000 holds steady:

while the SP500 downward trend accelerates:

and momentum is weakening:


while the SP500 downward trend accelerates:

and momentum is weakening:

Sunday, June 07, 2015
$IWM Pattern and Trend
The broader market, as represented by the Russell 2000 has, so far, remained immune to the recent sell-off in the SP500, and continues trading in a narrow range just below the highs:


Friday, June 05, 2015

Thursday, June 04, 2015
$SPY and Grexit
While Greece, to the delight to everybody watching, is kicking the can down the road for another month, the SP500 just broke below 2100 which opens the door for a new downside target:


Wednesday, June 03, 2015
$SPY Pattern and Trend
SPY unable to break outside last week's range, painting the third consecutive indecision candle for the current week:

(chart courtesy of OT Signals)

(chart courtesy of OT Signals)
Tuesday, June 02, 2015
$SPY Pattern and Trend
One more indecision candle for the SP500:

2100 remains the key level to watch for signs of trouble ahead.

2100 remains the key level to watch for signs of trouble ahead.
$SPY Pattern and Trend
A late day sell-off pushed the close down towards the middle of the range, and the whole candle traced inside last week's range, a sign of continued indecision:

For the SP500 2100 is the key support level to watch for signs of further weakening.
Monday, June 01, 2015
$SPY Angles and Trend
SPY targeting the top of last week's range:

the natural cycle needs a couple of days to turn positive.

the natural cycle needs a couple of days to turn positive.
Subscribe to:
Posts (Atom)
